Sampling & Types of Data
Section 1.1 & 1.2Nine objectives, two sections
Describe the investigative process of statistics
Construct a simple random sample
Determine when samples of convenience are acceptable
Describe stratified sampling, cluster sampling, systematic sampling, and voluntary response sampling
Distinguish between statistics and parameters
Understand the structure of a typical data set
Distinguish between qualitative and quantitative variables
Distinguish between ordinal and nominal variables
Distinguish between discrete and continuous variables
Describe the investigative process of statistics

The investigative process of statistics
Before an election, polls often tell the percentages of voters that prefer each candidate. Polling follows a process that is typical in statistics.
Statistics is an investigative process that involves these steps:
 Definition
Terminology
Often, we want information about a large group of individuals but are only able to collect information on a small part of that group.
Statistics is the study of procedures for collecting, describing, and drawing conclusions from information.
A population is the entire collection of individuals about which information is sought.
A sample is a subset of a population containing the individuals that are observed.

Simple random sampling
Ideally, we would like our sample to represent the population as closely as possible. Unfortunately, there are no methods that can guarantee this.
The best sampling methods all involve random selection. The most basic, and in many cases the best, sampling method is the method of simple random sampling.
Construct a simple random sample
DefinitionSimple random sample
A simple random sample of size is a sample chosen by a method in which each collection of population items is equally likely to make up the sample.
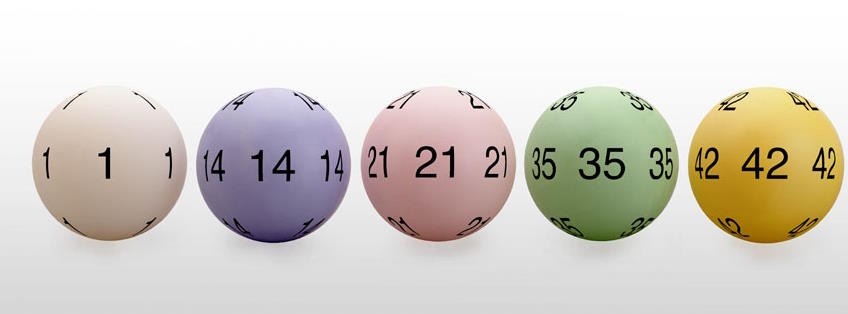
A simple random sample is analogous to a lottery. Suppose that 10,000 lottery tickets are sold and 5 are drawn as the winning tickets. Each collection of 5 tickets that can be formed is equally likely to comprise the group of 5 that is drawn.

 Example 1
Simple random sample
A physical education professor wants to study the fitness levels of 20,000 students at her university. She numbers the students from 1 to 20,000, then uses a random number generator to select 100 students to participate in the study. Is this a simple random sample?
 Example 2
Simple random sample
The professor now wants to survey 50 students about which sports they play. She uses her 10:00 am class of 50 students to fill out the questionnaire. Is this a simple random sample?

Determine when samples of convenience are acceptable
 Definition
Samples of convenience
In some cases, drawing a truly random sample is difficult or impossible. In these cases, a convenient method is sometimes used instead.
A sample of convenience is one that is selected without following a well-defined random process.
ExampleSample of convenience
A construction engineer received 1,000 concrete blocks in a large pile and wants to test the strength of 10 blocks. Why might it be difficult to draw a simple random sample?
Describe stratified sampling, cluster sampling, systematic sampling, and voluntary response sampling
 Definition
Stratified random sampling
In stratified random sampling, the population is divided into groups, called strata, and a simple random sample is drawn from each group (stratum).
This method is useful when the strata differ from one another, but the individuals within a stratum tend to be similar.
ExampleStratified random sampling
A company with 800 full-time and 200 part-time employees wants to draw a sample of 100. They select a simple random sample of 80 full-time employees and 20 part-time employees.
 Definition
Cluster sampling
In cluster sampling, items are randomly selected in groups, or clusters, from the population. This method is useful when the population is too large and spread out for simple random sampling to be feasible.
To estimate the unemployment rate, a government agency randomly samples households in a county and asks how many adults live there and how many are unemployed. What are the clusters? Why is this considered a cluster sample?
ExampleCluster sampling
The clusters are the groups of adults in each of the households. This is a cluster sample because a simple random sample of clusters is selected and every individual in each selected cluster is part of the sample.
DefinitionSystematic sampling
In systematic sampling, items are ordered, and every th item is selected for the sample. This method is often used to sample products on an assembly line to ensure they meet quality standards.
Automobiles are coming off an assembly line, and a systematic sample will be taken for inspection. Starting with the third car, every fifth car will be sampled. Which cars will be selected?
 Example
Systematic sampling
The sample begins with the third car, followed by every fifth car. The cars sampled will be the 3rd, 8th, 13th, 18th, 23rd, and so forth.

Voluntary response sampling
Voluntary response samples are often used by the media to try to engage the audience. For example, a radio announcer will invite people to call the station to say what they think.
Voluntary response samples are never reliable for the following reasons:
People who volunteer an opinion tend to have stronger opinions than is typical of the population.
People with negative opinions are often more likely to volunteer their response.
What we covered
Stratified, cluster and systematic all use randomness — but none of them is a simple random sample.
 Interactive
Draw a sample from 1,000 employees
 Check your understanding 3
What type of sample is it?
A podcaster uses social media to ask listeners their opinions on an upcoming election, receiving over 10,000 responses. What type of sample is this?
Every 10 years, the U.S. Census Bureau counts everyone living in the U.S. To verify accuracy in a specific city, they sample census districts and recount the people in those districts. What type of sample do these recounted individuals form?
Check your understanding 4What type of sample is it?
A researcher studying the effect of diet on heart disease selects a simple random sample of 100 men and another of 100 women, knowing their diets differ and that men are more susceptible to heart disease. What type of sample do these 200 people represent?
A college basketball team held a promotion at one of its games in which every twentieth person who entered the arena won a free basketball. What type of sample do the winners represent?
Check your understanding 5What type of sample is it?
A restaurant manager stops by the tables of people in the restaurant and asks them for their opinions on upcoming menu changes. What type of sample is this?
To select people to call for jury duty, a numbered list of all residents with driver’s licenses or ID cards is made. Then random numbers are generated, and the people corresponding to those numbers are selected. What type of sample is this?
Distinguish between statistics and parameters
DefinitionStatistic vs. parameter
We often use numbers to describe, or summarize, a sample or a population.
A statistic is a number that describes a sample.
A parameter is a number that describes a population.
Note how statistic and sample both start with “s” and parameter and population both start with “p”.
ExampleStatistic and parameter
Decide whether the number describes a statistic or a parameter:
57% of the teachers at Central High School are female.
In a sample of 100 surgery patients who were given a new pain reliever, 78% of them reported significant pain relief.
Understand the structure of a typical data set
DefinitionMajor, final exam score, and grade for several students
| Student | Major | Exam score | Grade |
|---|---|---|---|
| 1 | Psychology | 92 | A |
| 2 | Business | 75 | B |
| 3 | Communications | 82 | B |
| 4 | Psychology | 72 | C |
| 5 | Art | 85 | B |
Information is collected on individuals.
The characteristics of the individuals about which we collect information are called variables.
The values of the variables that we obtain are the data.
The information collected is called a data set.
Distinguish between qualitative and quantitative variables
DefinitionQualitative and quantitative variables
Variables can be divided into two types.
ExampleQualitative and quantitative
Decide whether each of the following describes qualitative variables or quantitative variables.
A person’s age
A person’s place of birth
The mileage of a car
The color of a car
Distinguish between ordinal and nominal variables
DefinitionOrdinal and nominal
Qualitative variables can be further divided into ordinal and nominal variables.
ExampleOrdinal and nominal
Decide whether each of the following describes ordinal variables or nominal variables.
State of residence
Hair color
Letter grade in a class (A, B, C, D, or F)
Size of drink ordered
Check your understanding 2Nominal or ordinal?
Categorize each of the following as nominal or ordinal.
The names of streets in a town
Movie ratings G, PG, PG-13, R, and NC-17
Distinguish between discrete and continuous variables
DefinitionDiscrete and continuous
Quantitative variables can be further divided into discrete and continuous variables.
ExampleDiscrete and continuous
Decide whether each of the following describes discrete variables or continuous variables.
Age of a person at their last birthday
Height of a person
Number of siblings a person has
Distance a person commutes to work
Types of variables
Interactive