The Binomial Distribution
Section 6.2Binomial Distribution
Your favorite restaurant is giving away a coupon with every meal purchase. Twenty percent of the coupons entitle you to a free milkshake; the rest say “better luck next time.”
Ten of you order lunch. What is the probability that exactly three of you win a free milkshake?
This is not straightforward — the answer depends on the number of ways to get three winners from ten.
If we let be the number of winners out of ten, then follows what's called the binomial distribution, one of the most useful probability distributions.

Determine whether a random variable is binomial
Conditions for a Binomial Distribution
In this example, each coupon examined is a “trial,” so there are 10 trials. A coupon good for a free milkshake is a “success.” The random variable represents the number of successes in 10 trials.
A random variable that counts successes in a series of trials has a binomial distribution if:
The number of trials is fixed.
Each trial has two possible outcomes: “success” or “failure.”
The probability of success is the same on each trial.
The trials are independent—the outcome of one trial does not affect the others.

 Example
Example: Binomial Experiment
Decide if the following scenario describes a binomial experiment:
A quiz has 8 true/false questions. A student guesses randomly on each one. Let be the number answered correctly.
This is a binomial experiment. Each question is a trial with two outcomes, the probability of success is 0.5 for each, and the trials are independent.
 Example
Example: Binomial Experiment
Decide if the following scenario describes a binomial experiment:
Five basketball players each attempt a free throw. Let be the number made.
This is not a binomial experiment. The probability of success differs from player to player.
 Example
Example: Binomial Experiment
Decide if the following scenario describes a binomial experiment:
A bowl contains 10 notes: 5 for indoor activities, 5 for outdoor. A team draws three notes without replacement. Let be the number of outdoor activities drawn.
This is not a binomial experiment. The trials are not independent.

 Check your understanding
Quick Round — Binomial or Not?

a) A dating app shows your profile to 20 randomly selected users. = number who swipe right.
Binomial. The number of trials is fixed at 20, each user swipes right or not, the probability of success is the same for randomly selected users, and the decisions are independent.

b) You open TikToks until you find one you like. = number opened.
Not binomial. The number of trials is not fixed — you keep going until you find one you like.

c) Five friends each play a different Wordle puzzle. = number who solve it.
Not binomial. The probability of success differs from puzzle to puzzle.
Determine the probability distribution of a binomial random variable
The Binomial Probability Distribution
Consider tossing a biased coin 3 times, where the probability of heads is 0.6. To find , note that there are 3 arrangements of two heads: HHT, HTH, THH. Each has probability .
So,
the number of ways of arranging exactly two heads among the three tosses
the probability of a success, raised to the second power — two is the number of successes wanted
the probability of a failure — the complement of the probability of a success — raised to the first power even though the exponent is not written, because
For a binomial random variable with trials and success probability :
where is the number of ways of arranging successes among trials.

 Interactive
Exploring the Shape of the Binomial Distribution
The shape of the binomial distribution depends on both and .
Compute binomial probabilities
Binomial Probabilities on the Statistics Calculator
On the Statistics Calculator, the Binomial tool computes binomial probabilities. Enter the number of trials , the success probability , choose the form of the probability to find, and enter .
https://barrymonk.com/stats-calculator/

Binomial Probabilities on the TI-84 Plus
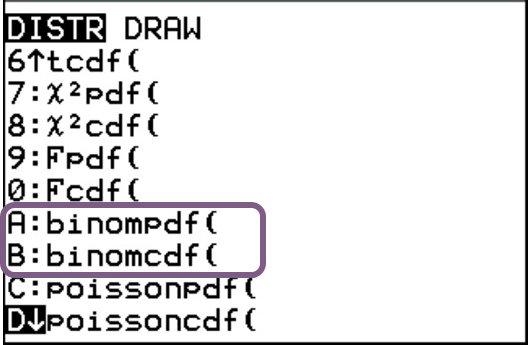
On the TI-84 Plus, two commands compute binomial probabilities: binompdf and binomcdf. Both are on the DISTR menu (2nd → VARS).
Use binompdf to find the probability that equals a specific value.
Use binomcdf to find the probability that is less than or equal to a specific value.
 Example
Example: Binomial Distribution (Statistics Calculator)
Approximately 30% of people use the image sharing website Pinterest. A simple random sample of 15 people is taken. Use the binomial probability distribution to find the following probabilities.
Find the probability that exactly four of the sampled people use Pinterest.
Find the probability that fewer than three of the people use Pinterest.
Find the probability that more than one person uses Pinterest.
Find the probability that the number of people who use Pinterest is between 1 and 4, inclusive.
 Example
Example: Part a) (Statistics Calculator)

We have and .
Find the probability that exactly four of the sampled people use Pinterest.
Since we are finding the probability that equals 4, we choose with , , and , .
We find the probability that exactly four people use Pinterest is approximately 0.219.
 Example
Example: Part a) (TI-84 Plus)
Find the probability that exactly four of the sampled people use Pinterest.
 Example
Example: Part b) (Statistics Calculator)
Find the probability that fewer than three of the people use Pinterest.
The event “fewer than three” is equivalent to “less than or equal to two”.
We choose with .
The probability that fewer than three people who use Pinterest is 0.1268.
 Example
Example: Part b) (TI-84 Plus)
Find the probability that fewer than three of the people use Pinterest.
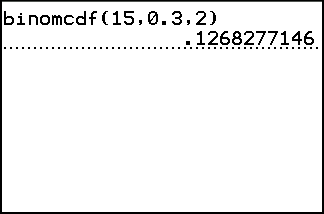
The binomcdf command computes the probability that there are less than or equal to successes — two or fewer. Entering 3 would give , which is wrong here.
ExampleExample: Part c) (Statistics Calculator)
Find the probability that more than one person uses Pinterest.
We choose with .
The result is approximately 0.965.
We could also use the Rule of Complements: the complement of “more than 1” is “1 or fewer,” so . Choosing with gives 0.0353, and .
 Example
Example: Part c) (TI-84 Plus)
Find the probability that more than one person uses Pinterest.
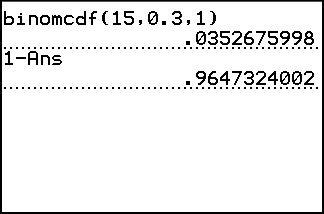
gives the probability that 1 or fewer people use Pinterest; then 1 − Ans.
ExampleExample: Part d) (Statistics Calculator)
Find the probability that the number of people who use Pinterest is between 1 and 4, inclusive.
Because , we choose Between a and b with and .
The result is approximately 0.511.
 Example
Example: Part d) (TI-84 Plus)
Find the probability that the number of people who use Pinterest is between 1 and 4, inclusive.
 Check your understanding
Check Your Understanding
An environmentalist plants three types of trees, each with probability 0.4 of adapting to the local climate.
Find the probability that none of these successfully adapt to the environment.
0.216
Find the probability that at least two of the trees adapt to the local climate.
0.352
 Check your understanding
Check Your Understanding
A 2017 government investigation found that airport screeners failed to detect prohibited items approximately 80% of the time. If someone attempts to sneak 3 prohibited items through security, find the probability that at least one is caught.

Compute the mean and variance of a binomial random variable
Mean and Standard Deviation
Let be a binomial random variable with trials and success probability .
Then the mean of is
The standard deviation of is
 Example
Example: Mean and Standard Deviation
The probability that a new car of a certain model will require repairs during the warranty period is 0.15. A dealership sells 80 such cars. Let be the number that will require repairs during the warranty period. Find the mean and standard deviation of .
The mean is .
The standard deviation is:
The mean tells us that in the long run, 12 out of every 80 cars will require repairs. The standard deviation measures the spread in the number of cars requiring repairs.
 Check your understanding
Check Your Understanding
Gregor Mendel studied heredity in pea plants. When parent plants carry genes for both green and yellow pods, offspring have a 0.75 probability of green pods. Assume 80 such plants are produced.
Find the mean number of plants with green pods.
Find the standard deviation.

 Case study