Confidence Intervals for a Population Proportion
Section 8.3 Case Study
Social Media Breaks for Mental Health
A 2024 Statista survey found that 35% of U.S. adults reported taking an extended break from social media because it harmed their mental health.
A university researcher wants to determine whether the proportion among college students differs from the national rate. She surveys a random sample of 300 college students and finds that 126 of them have taken such a break.

Population
What we want
Sample
What we know
What can we conclude about the proportion of all college students who have taken a social media break for mental health reasons?
Point Estimate
Our "best guess" is the sample proportion:
This is our point estimate: a single value used to estimate the population proportion .
The point estimate of 0.42 is our best guess for , but it's unlikely to be exactly correct. A more useful approach is to provide a range of possible values.
Interval Estimate
An interval allows us to state our confidence that falls within a range.
A confidence interval is an interval that is used to estimate the value of a parameter.
Confidence Level
Begin by setting a level of confidence
Why not 100%? We could be 100% confident by saying is between 0 and 1, but that tells us nothing.
How do we determine the margin of error for a given level of confidence?
The answer lies in understanding how behaves across all samples. We use the sampling distribution of .
Sampling Distribution
By the Central Limit Theorem for Proportions:
We don't know , so we substitute to obtain the standard error we use for the confidence interval:
Standard error
The Middle 95%
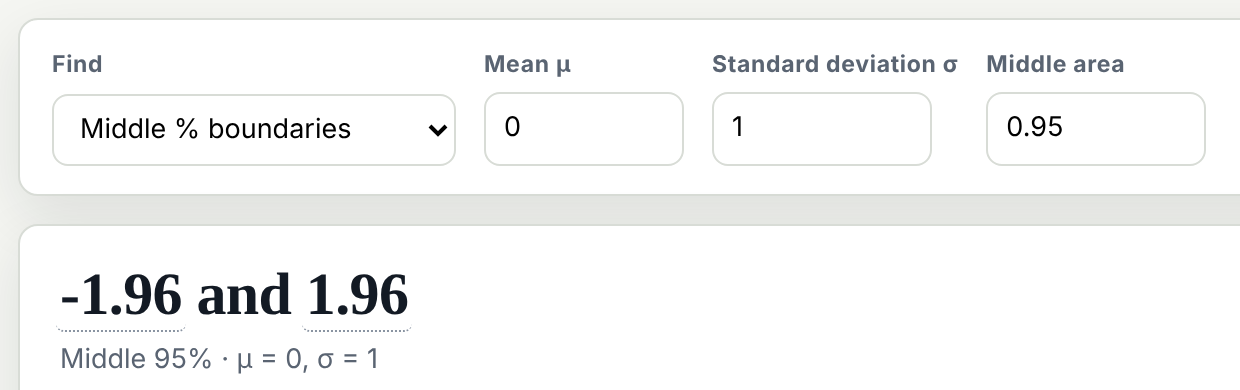

Within 1.96 Standard Errors
Suppose lands somewhere under this curve. Draw an interval around it that reaches on each side.
The interval contains .
Drag around the middle area.
Drag out into one of the tails.
Drag into the other tail.
When lands in the middle area, its interval contains .
When lands in a tail, its interval misses .
So for about 95% of all samples, the interval contains .
Margin of Error
We know:
Rearranging to isolate :
This is precisely in the form Margin of Error
Margin of Error = (Critical Value)·(Standard Error)
Margin of Error
It depends on the confidence level.
It uses in place of .
Assumptions
Constructing a confidence interval for a population proportion requires the sampling distribution to be approximately normal.
The following assumptions ensure this:
Case StudySocial Media Breaks for Mental Health
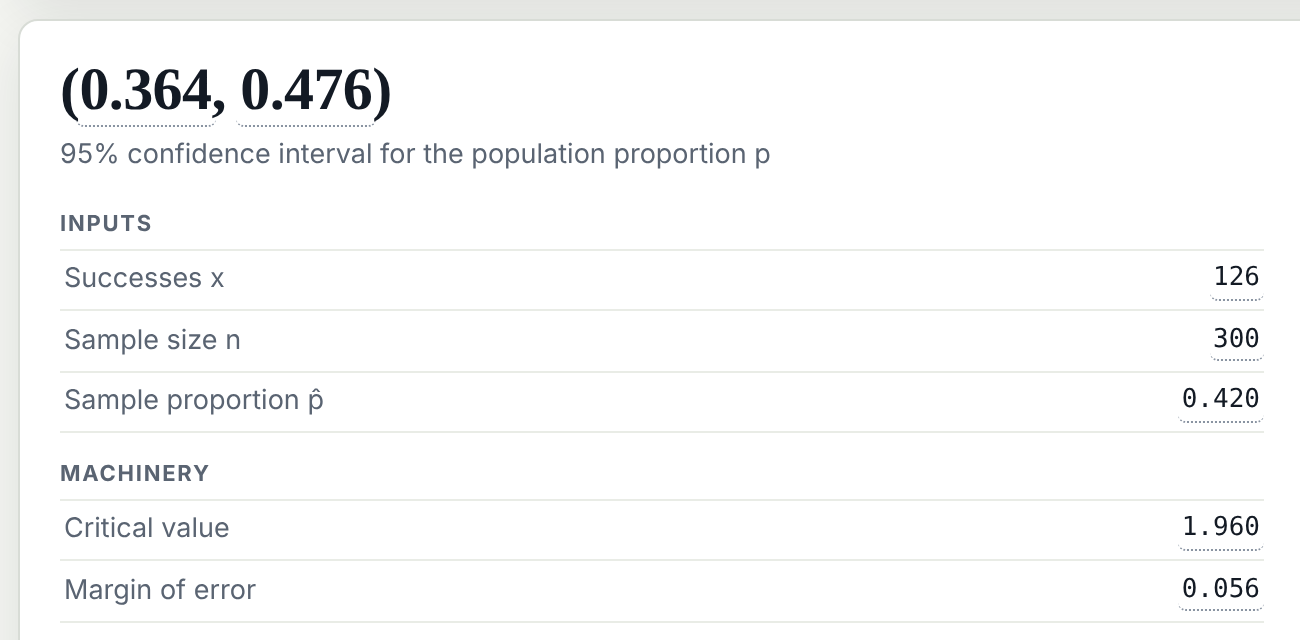
Point Estimate:
Confidence Level:
Critical Value:
Standard Error:
Margin of Error: (Critical Value)·(Standard Error)
Confidence Interval: Point Estimate ± Margin of Error
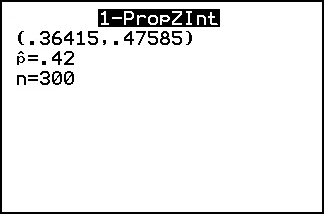
We are 95% confident that the proportion of college students who took a social media break was between 0.364 and 0.476.
Population
What we want
Sample
What we know
Confidence Interval Formula
Critical Value: depends on the confidence level
is the area outside the middle. At 95%, , and is the area in each tail.
The larger the confidence level, the larger the critical value.
Case StudySocial Media Breaks for Mental Health


confidence level 95%
Case StudySocial Media Breaks for Mental Health
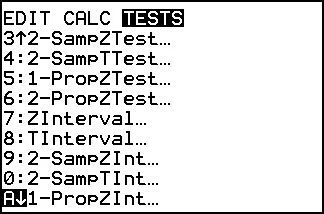
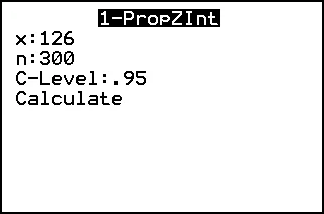
 Case Study
Social Media Breaks for Mental Health
A 2024 Statista survey found that 35% of U.S. adults reported taking an extended break from social media because it harmed their mental health.
A random sample of 300 college students found that 126 of them have taken such a break.
We are 95% confident that the proportion of college students who took a social media break was between 0.364 and 0.476.
Population
What we want
Sample
What we know
Because 0.35 does not fall within this interval, the confidence interval suggests that the proportion among college students differs from the national rate.
What does "95% confident" actually mean?
Incorrect interpretation: "There is a 95% probability that is in this interval."
Once the interval is computed, is either in it or it's not. There's no probability involved for any single interval.
"If we repeated this procedure many times, about 95% of the resulting intervals would contain ."
The confidence level describes how often the method succeeds, not the probability for any particular interval.
The confidence level is a percentage between 0% and 100% that measures the success rate of the method used to construct the confidence interval.
What does "95% confident" actually mean?
In the long run, about 95% of the intervals contain .
What we'll do: take sample after sample of size from a population where , and build a 95% confidence interval from each one.
What to look for: the percent of intervals that contain .
In the long run, about 95% of the intervals contain .
- Most intervals contain , but now and then one misses.
- The intervals that miss come from values of in the tails.
Press Draw 1 a few times.
Watch whether each interval reaches .
Press Draw 50.
If every interval reaches , press Draw 50 again.
Keep pressing Draw 50.
Watch the percent that contain .
Changing the Confidence Level
What we'll do: draw samples of size at 95%, then change the confidence level to 99%, and then to 90%. The machine keeps the same samples and redraws their intervals.
What to look for: how long the intervals are, and the percent that contain .
More confidence means wider intervals.
- A wider interval contains more often, but it may be too wide to be useful.
- Less confidence means narrower intervals, and more of them miss .
Press Draw 50 twice at 95%.
Then click 99%.
Click 90%.
Watch the same intervals get shorter.
Changing the Sample Size
What we'll do: at 95%, draw 50 samples of size , then 50 samples of size .
What to look for: how long the intervals are, and whether the percent that contain changes.
Larger samples give narrower intervals.
- The percent that contain stays near 95%.
Press Draw 50 at .
Then click 1,000 and press Draw 50 again.
 Check your understanding
Correct Interpretation or Not?
Each statement is about the case study's 95% confidence interval, 0.364 to 0.476. Is it a correct interpretation?
(a)We are 95% confident that the proportion of all college students who took a social media break is between 0.364 and 0.476.
(a)Correct. It describes the proportion of all college students, with 95% confidence.
(b)There is a 95% probability that is between 0.364 and 0.476.
(b)Incorrect. Once the interval is computed, is either in it or it's not.
(c)Between 36.4% and 47.6% of the 300 students surveyed took a social media break.
(c)Incorrect. Exactly 42% of the 300 students surveyed took a break; the interval is about all college students.
(d)If we took another sample of 300, there's a 95% chance its would be between 0.364 and 0.476.
(d)Incorrect. The interval is a range of values for , not a prediction of where the next will land.
ExampleExample 1: Meal Kit Delivery
Among 242 households surveyed, 107 reported using a meal kit delivery service in the past year. Construct a 90% confidence interval. Industry analysts claim 43% of households have tried meal kit services. Does the confidence interval contradict this claim?
Check the assumptions:
 Example
 1: Meal Kit Delivery
Construct a 90% confidence interval. Industry analysts claim 43% of households have tried meal kit services. Does the confidence interval contradict this claim?

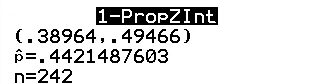
We are 90% confident that the true proportion of households that have used a meal kit service is between 0.390 and 0.495.
Because 0.43 falls within this interval, the confidence interval does not contradict the claim.
ExampleExample 2: Remote Work
In a survey of 432 office workers, 108 said they prefer fully remote work over hybrid or in-person options. Construct a 99% confidence interval. Workplace consultants claim more than 32% of workers prefer fully remote. Does the confidence interval contradict this claim?
Check the assumptions:
 Example
 2: Remote Work
Construct a 99% confidence interval. Workplace consultants claim more than 32% of workers prefer fully remote. Does the confidence interval contradict this claim?

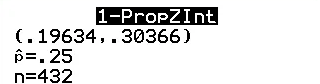
We are 99% confident that the true proportion of office workers who prefer remote work is between 0.1963 and 0.3037.
Because every value in this interval is less than 0.32, the confidence interval contradicts the claim.
ExampleExample 3: Flagged Returns
An online retailer reviewed 1,000 returns and found that 6 were flagged as potentially fraudulent. Construct a 95% confidence interval. Industry analysts estimate that 2% of online returns are fraudulent. Does the confidence interval contradict this claim?
Check the assumptions:
We cannot construct a valid confidence interval using the methods of this section.
 Example
 4: AI Accelerator Chips
A data center received a shipment of AI accelerator chips. A quality control engineer tested a random sample of 200 chips and found that 24 failed to meet performance specifications. Construct a 95% confidence interval. The supplier claims that fewer than 10% of chips fail specifications. Does the confidence interval contradict this claim?
Check the assumptions:
 Example
 4: AI Accelerator Chips
Construct a 95% confidence interval. The supplier claims that fewer than 10% of chips fail specifications. Does the confidence interval contradict this claim?

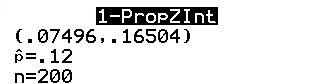
We are 95% confident that the true proportion of AI accelerator chips that fail to meet specifications is between 0.075 and 0.165.
Because this interval contains values less than 0.10, the confidence interval does not contradict the claim.
You Are Ready For:
8.3: Confidence Intervals for a Population Proportion
Find a point estimate and a margin of error
Check the four assumptions
Construct a confidence interval for , by hand or with technology
Interpret it, and decide whether it contradicts a claim
Explain why more confidence means a wider interval