Hypothesis Tests for Proportions and Means
Sections 9.3 & 9.4 Case Study
The 5-Second Rule
You drop a piece of food on the floor. Is it still safe to eat if you pick it up fast enough?
A 2024 survey found that 44% of U.S. adults believe in the "5-second rule," assuming bacteria need time to accumulate. However, the science tells us that bacteria can transfer to food almost instantly upon contact.
 Case Study
The 5-Second Rule
A campus health researcher suspects that college students are more likely than the general public to follow the 5-second rule. She surveys a random sample of 200 college students and finds that 102 of them believe in it.
The sample proportion is , which is higher than the national rate of 0.44. But is that difference large enough to draw a real conclusion, or could it simply be due to chance?
Case StudySetting Up the Test

To answer this question, we perform a hypothesis test.
The null hypothesis is that college students believe in the 5-second rule at the same rate as the general public:
The alternate hypothesis represents the claim that college students are more likely to believe in it:
We have a right-tailed test.
Case StudyThe Logic of the Test
We assume the null hypothesis is true and ask: if really were 0.44, how likely would we be to observe a sample proportion as high as 0.51?
If that outcome would be very unlikely, we reject . If it's reasonably likely, we do not reject .
Before performing the test, we choose a significance level : the maximum probability of a Type I error we are willing to accept.
A Type I error means rejecting when it's actually true: concluding that college students are more likely to believe the 5-second rule when they actually are not.
We use (the most common choice).
 Case Study
The Test Statistic
If is true, follows an approximately normal distribution with and standard error: .
We compute a quantity called the test statistic, which is the -score of : .
The observed value is fairly far out in the tail of the distribution, well above the null hypothesis value . Intuitively, the evidence against appears to be strong.
We need a way to measure precisely how far out really is.
Case StudyThe -Value
The -value answers this question:
If were true, what is the probability of observing a test statistic as extreme as ours, or more extreme?
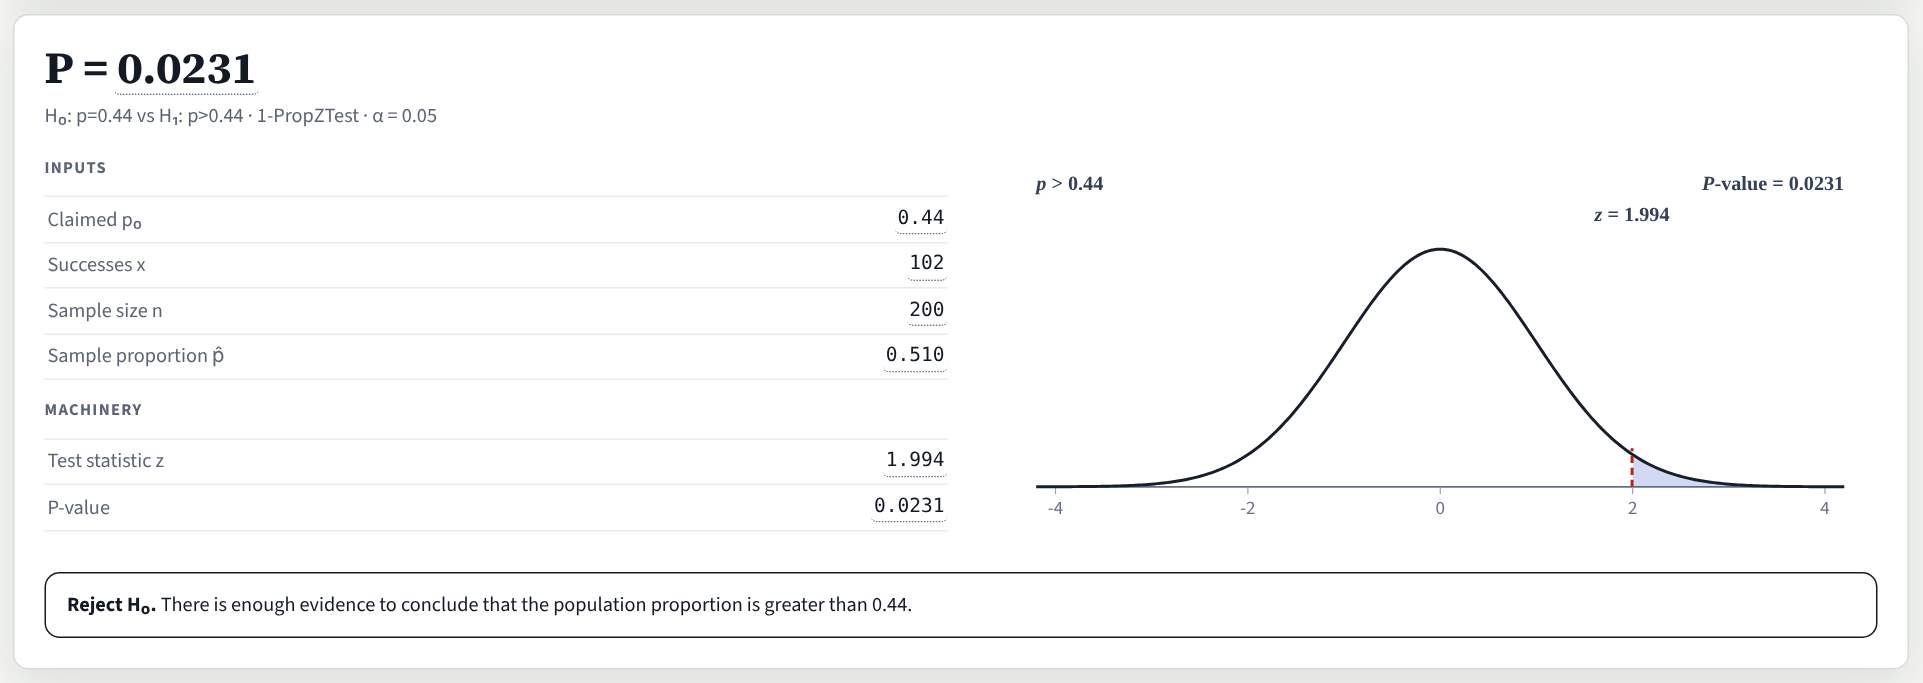
For a right-tailed test, the -value is the area to the right of , which we find to be 0.0231. In other words, if the true proportion were 0.44, there's only about a 2.3% chance of getting a sample proportion as high as 0.51.
Watching the -Value Change
What we'll do: drag from 1.994 farther out to the right, then switch to a two-tailed test.
What to look for: the shaded area and the -value.
Drag out to 2.5.
The farther out the test statistic, the smaller the -value.
- At , the -value is 0.0062.
- Two-tailed: both tails count, so the -value doubles, to 0.0124.
Press Two-tailed.
The -Value
The smaller the -value, the stronger the evidence against .
| -value | Interpretation |
|---|---|
| Less than 0.01 | Very strong evidence against |
| 0.01 to 0.05 | Strong evidence against |
| 0.05 to 0.10 | Moderate evidence against |
| Greater than 0.10 | Weak (or very little) evidence against |
How small does the -value have to be to reject ?
Less than or equal to the significance level .
If -value → Reject
Otherwise → Fail to reject
Case StudyThe 5-Second Rule
Because the -value (0.0231) is less than the level of significance (0.05), we reject .
There is sufficient evidence at the level to conclude that college students are more likely than the general public to believe in the 5-second rule.
 Check your understanding
Make the Decision
A city library reports that 30% of residents hold a library card. A librarian suspects the rate is higher, so she tests vs. . Her -value is 0.018.
(a)She tests at . Does she reject ? State the conclusion.
(b)She tests at instead. Does she reject ? State the conclusion.
Testing a Proportion with Technology


TI-84 Plus: 1-PropZTest
The 1-PropZTest command performs a hypothesis test for a population proportion. Access it by pressing STAT and choosing the TESTS menu.
The required inputs are and . If you know instead, you can compute .
Assumptions
The following assumptions are the conditions under which the Central Limit Theorems let us use standard inference methods for proportions and means.
| Testing a Population Proportion | Testing a Population Mean |
|---|---|
|
|
Why Assumptions Matter

Assumptions aren't formalities, they are the conditions under which the math is valid.
When assumptions are violated:
- -values become meaningless
- Conclusions can't be trusted
- Papers get retracted
Retraction Watch tracks scientific papers that have been withdrawn due to errors, fraud, or methodological problems, including statistical violations.
ExampleExample 1: Defect Rate

A manufacturer guarantees that no more than 8% of its products are defective. After upgrading equipment, quality control runs a routine audit. In a random sample of 400 items, 24 are defective. Does the data support that the defect rate has dropped below 8%? Test at .
vs.
Check assumptions:
- Simple random sample ✓
- Reasonable to believe that the population is at least 20 times as large as the sample ✓
- ✓
- ✓
ExampleExample 1: Defect Rate
In a left-tailed test, the -value is the area to the left of the test statistic.
Perform the test:

Because the -value is greater than , we do not reject .
There is not sufficient evidence to conclude that the defect rate has dropped below 8%.
ExampleExample 2: Public Transit

Before approving funding for modifying bus routes, a city council requires evidence that ridership has changed from the previous rate of 35%. A random sample of 250 residents finds that 30% commute by public transit. Use level of significance.
vs.
Check assumptions:
- Simple random sample ✓
- Reasonable to believe that the population is at least 20 times as large as the sample ✓
- ✓
- ✓
ExampleExample 2: Public Transit
Perform the test:

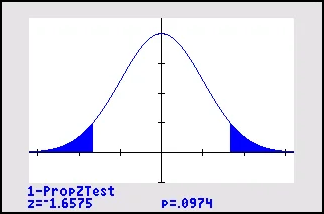
In a two-tailed test, the -value includes area from both tails: the probability of being this far from in either direction.
Because the -value is greater than , we do not reject .
There is not sufficient evidence to conclude that the proportion of residents who commute by public transit has changed from 35%.
Testing a Mean with Technology
When is unknown, the test statistic for a mean is .
If is true, it follows a Student's distribution with degrees of freedom.
TI-84 Plus: T-Test
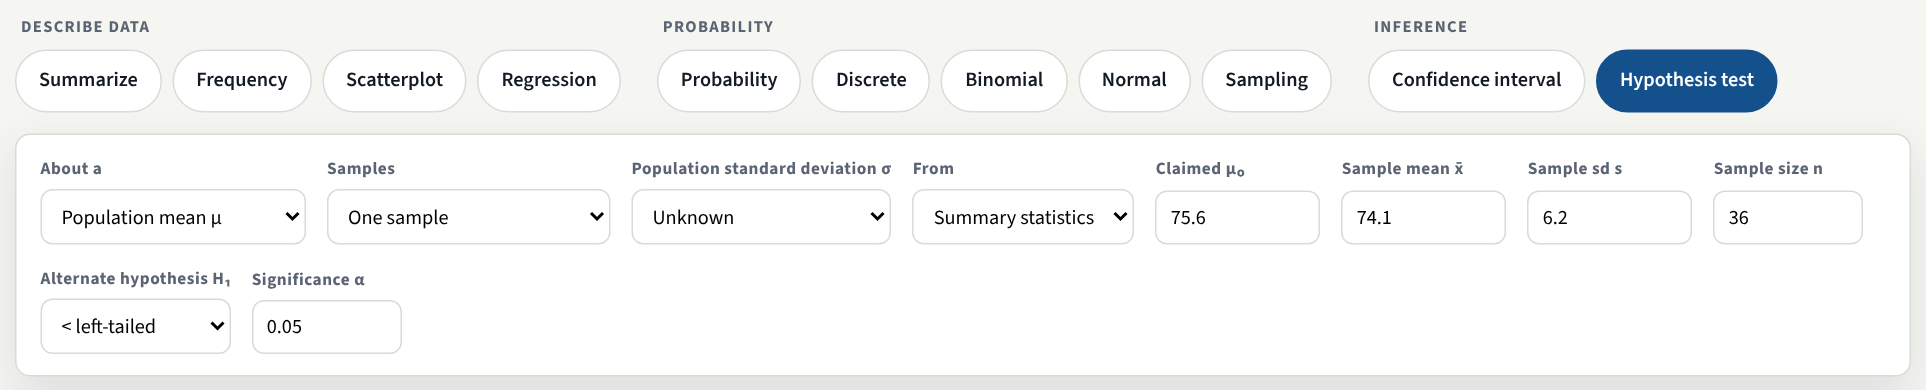
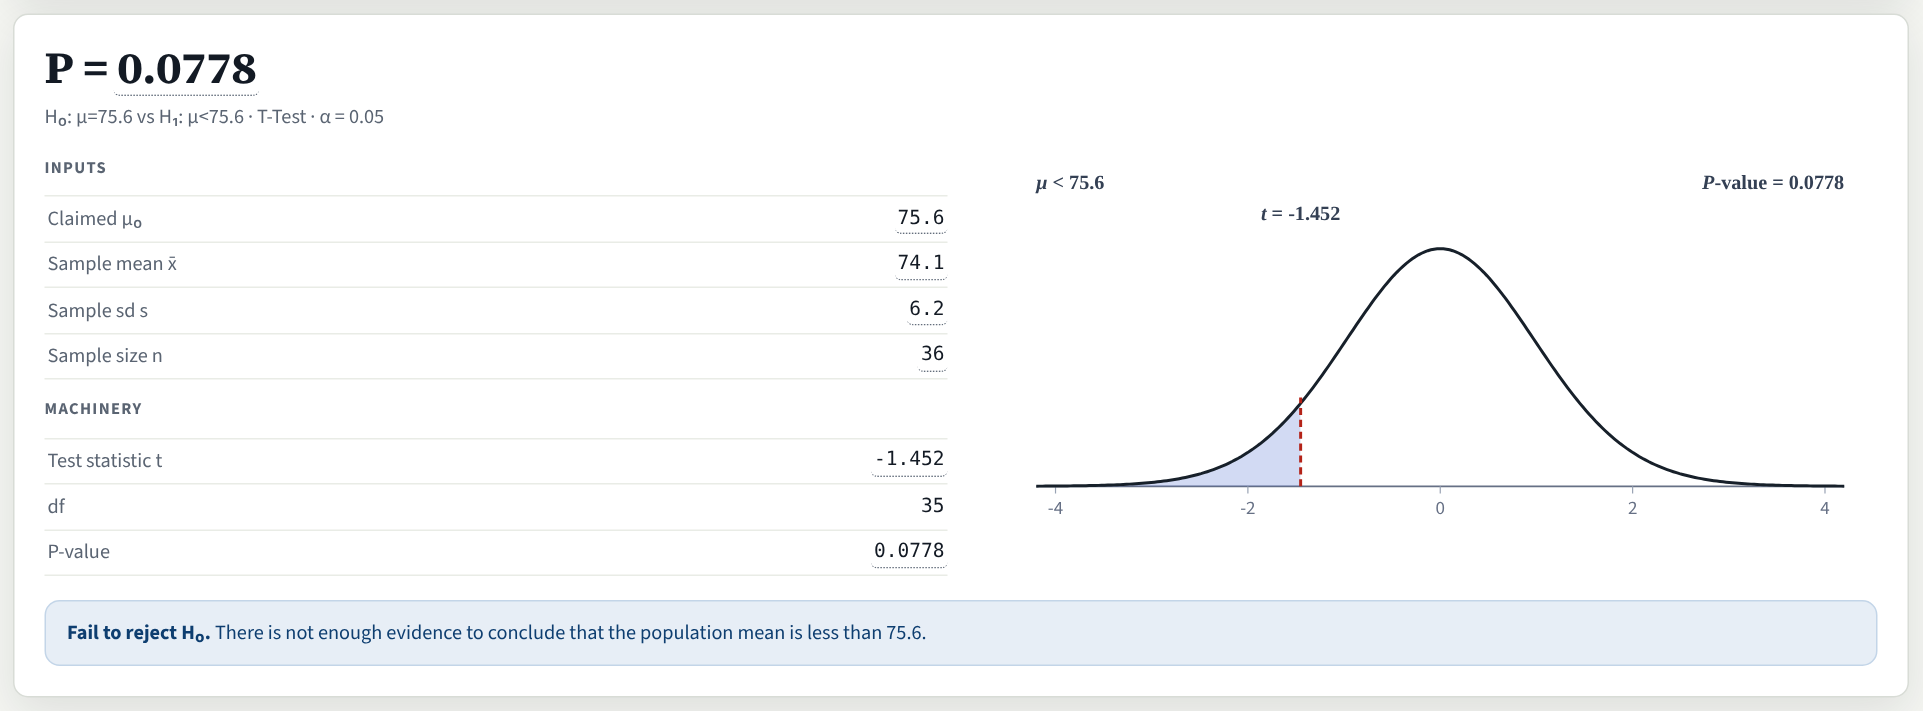
If we are testing a population mean, we use the T-Test command.
The required inputs are , , and .
ExampleExample 3: Battery Life
A smartphone manufacturer advertises 24-hour battery life. After complaints, the company runs a test. A random sample of 35 phones has a mean battery life of 22.1 hours with a standard deviation of 3.8 hours. Test whether the mean battery life is less than advertised. Use level of significance.
vs.
Check assumptions:
- Simple random sample ✓
- ✓
 Example
 3: Battery Life
Perform the test:

Because the -value is less than , we reject .
There is sufficient evidence to conclude that the mean battery life is less than 24 hours.
The customer complaints appear to be justified.
ExampleExample 4: Latte Calories

A nutrition blogger suspects that a coffee chain's vanilla latte contains more than the advertised 250 calories. She collects a random sample of 18 lattes from various locations. The sample has a mean of 281 calories with a standard deviation of 64 calories. At the 0.05 significance level, is there evidence that the mean exceeds 250 calories?
vs.
Check assumptions:
- Simple random sample ✓
- ✗
We have no information about the population to suggest it may be approximately normal.
We cannot justify performing the test.
The blogger would need to collect more data or provide evidence that calorie counts are approximately normally distributed.
ExampleExample 5: A Generic Drug
Before a generic drug can be sold in the U.S., the FDA requires testing to confirm it performs equivalently to the brand-name version. A pharmaceutical company tests a generic topical pain reliever. The brand-name version delivers a mean of 3.5 micrograms of active ingredient per square centimeter of skin.
Seven volunteers apply the generic ointment. After six hours, the amount absorbed (in micrograms) is:
2.63.22.13.03.12.93.7
Is there evidence at the level that the generic delivers a different amount?

vs.
Check assumptions:
- Simple random sample ✓
- → we must check for normality
There is no evidence of outliers or strong skewness,
so it is reasonable to assume the population is approximately normal.
ExampleExample 5: A Generic Drug
2.6, 3.2, 2.1, 3.0, 3.1, 2.9, 3.7
Perform the test:

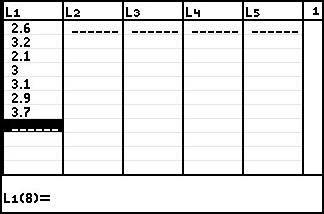
The -value is greater than , so we do not reject .
There is not sufficient evidence at the level to conclude that the mean amount absorbed differs from 3.5 micrograms.
You Are Ready For:
Sections 9.3 & 9.4: Hypothesis Tests for Proportions and Means
Find the test statistic and the -value, and use the -value to decide whether to reject
Check the assumptions before testing a population proportion or a population mean
Perform a test with technology, and state the conclusion in words